


Articles found on Wikipedia often sport maps formatted as SVG images. (Not to be confused with the popular designation of a Russian sniper rifle, SVG abbreviates ‘scalable vector graphics’, a format that allows people to treat the elements of a picture as if they were Lego™ bricks.)
The creators of these maps usually publish them under a ‘creative commons license’. This means that, as long as they provide proper attribution, members of the general public may use, or modify, the images as they see fit. (The license also forbids people from doing anything that would prevent downstream users from enjoying the same benefit.)
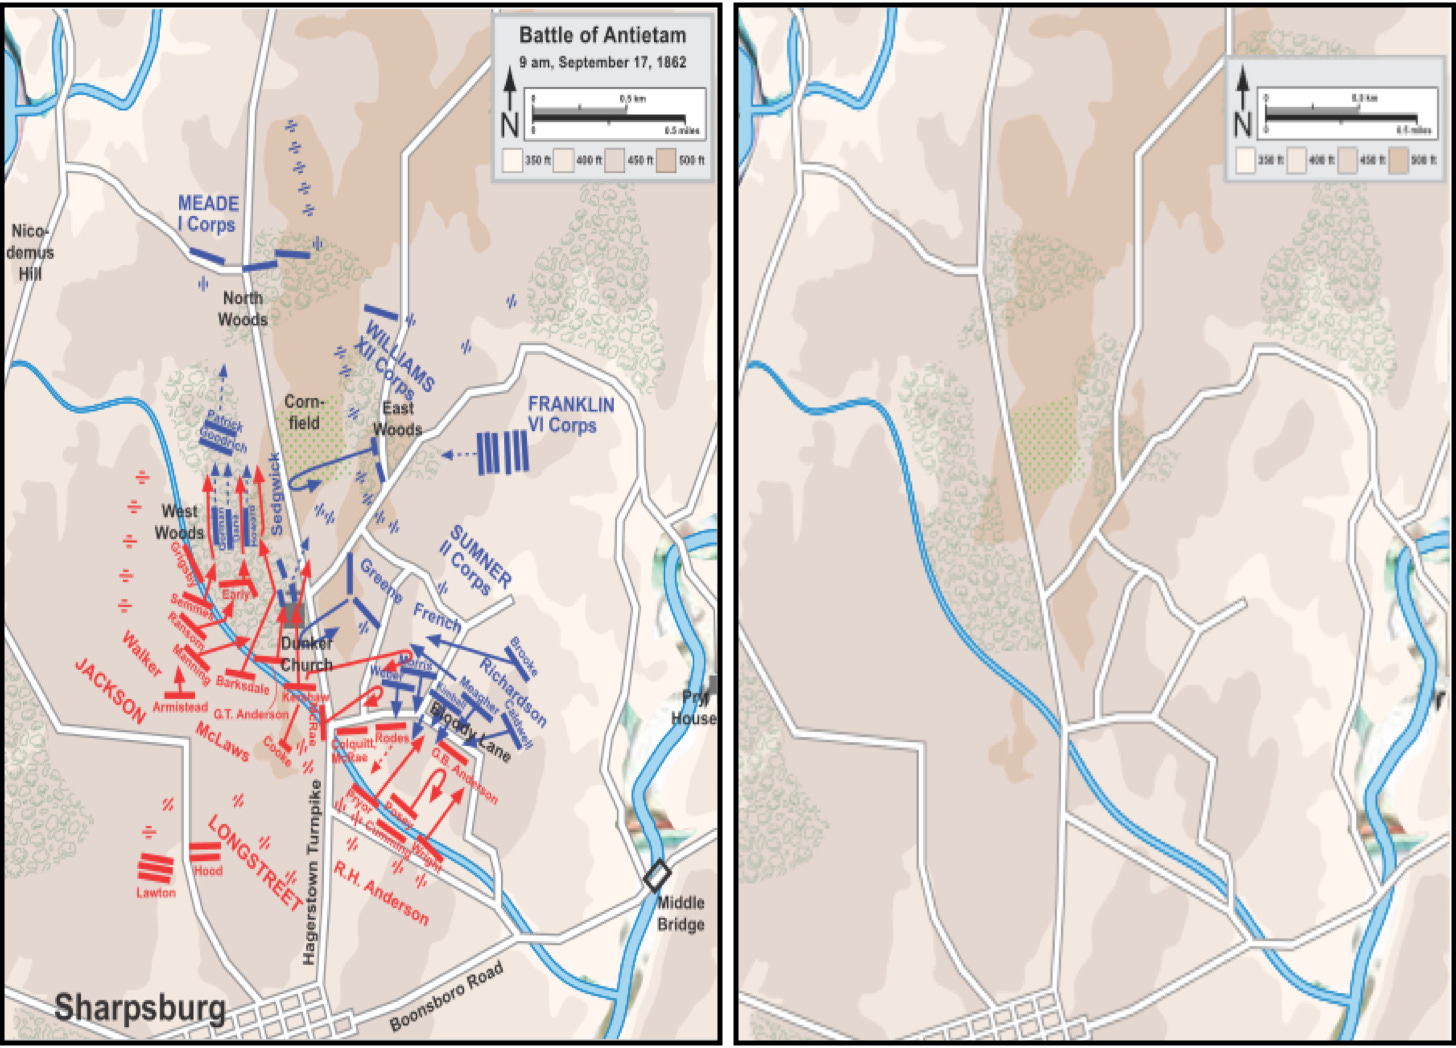
Earlier this century, cartographer Hal Jespersen made more two hundred maps of this sort to illustrate articles about the battles and campaigns of the American Civil War. Valuable in, and of, themselves, these maps also provide other students of history with the means of making high-quality maps of their own.
In order to do this, a would-be map maker needs to acquire a pair of application programs: one to remove elements from SVG images and one to add new elements to the modified picture. (I use a freeware app called Inkscape for the first purpose and Keynote, the proprietary presentation program bundled with MacIntosh operating systems, for the second.)
At times, the creator of an SVG map will use a feature called ‘layers’, which allows him to assemble elements of a given type (such as those that depict rivers, roads, towns, or units) onto the digital equivalent of a sheet of clear plastic. (Not that long ago, when drafting maps for books I wrote for Osprey Publishing, I used pieces of tracing paper to achieve the analog equivalent of this effect.)
If the creator of the original map used layers, then removing extraneous elements requires little in the way of time or trouble. If, however, the elements stand alone, the modifier of maps will have to remove superfluous information one piece at a time. (This will prove less difficult than it seems. So, if you can’t find layers on an image, put on a good podcast, grab your mouse, and get to work. You will be done in no time at all.)
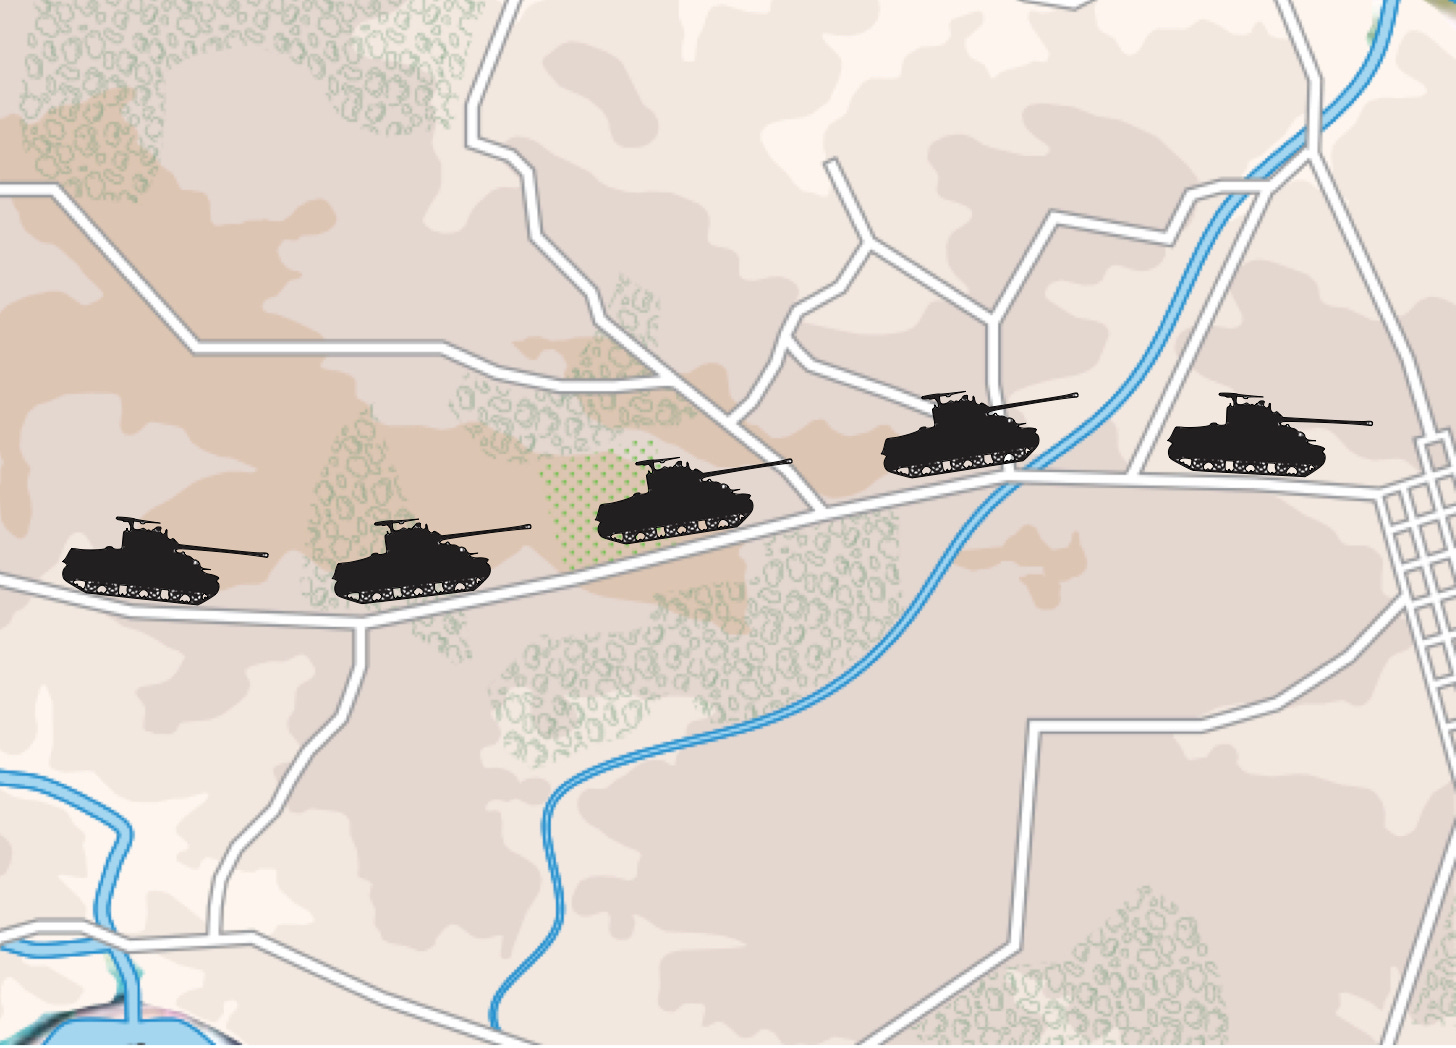
Once you have stripped all of the extra elements from a map, you can begin to add text, silhouettes, and tactical symbols of your own. You can do this in your SVG editing program. However, I find it easier to do this in my presentation program, especially as I have lots of icons, avatars, and such close to hand.
Few online publishers and few presentation programs accommodate SVG files. (Wikipedia and LibreOffice provide notable exceptions to this rule.) Thus, at some point in the process of making a map, you will have to convert it to a ‘bit map’ format, whether JPEG or PNG.
When you make this conversion, the image will lose its scalability. Thus, make sure that the size of the SVG image fits in with your plans before you convert it.
Speaking of conversion …
Over the course of the past few years, Mr. Jespersen has deprived many, if not most, of the Civil War maps he posts to Wikipedia of their Lego-like character. (He seems to have done this by creating his maps as SVG files, converting those files into PNG format, and then reconverting the PNG pictures into SVG images. While maps produced by this new method make a powerful impression, they cannot be ‘stripped’ in the manner described in this post.)
Happily, many of the maps made Mr. Jespersen can be found in the versions of the relevant articles written in languages other than English. Thus, for example, I found the maps used to illustrate this post in the article about the battle of Antietam on German-language Wikipedia.


